A business dashboard brings selected metrics, trends and exceptions into one view so a team can make a specific decision. An executive might review revenue and cash, while an operations manager needs overdue orders and a way to assign the next action. This guide explains ten examples, the KPIs to consider and how to build a useful daily dashboard.
Start with the decision rather than the chart. For example:
Illustrative operations question: Which products are below their reorder threshold, and who needs to approve replenishment today?
A dashboard also needs a clear boundary between observed facts and estimates:
Illustrative forecasting question: Which demand figures are actual orders, which are model estimates, and how uncertain are the estimates for a newly launched product?
These are design examples, not customer quotations. A dashboard is useful when it helps someone understand a change and take the appropriate next step. Moving a confusing spreadsheet into a web page does not fix unclear metric definitions or unreliable source data.
What are business dashboards?
A business dashboard is a visual interface that presents selected business metrics, trends and exceptions for an audience. It may refresh daily, periodically or through an event-driven connection. “Dashboard” does not automatically mean real-time data.
A useful dashboard must be understandable to its audience, as well as technically correct.
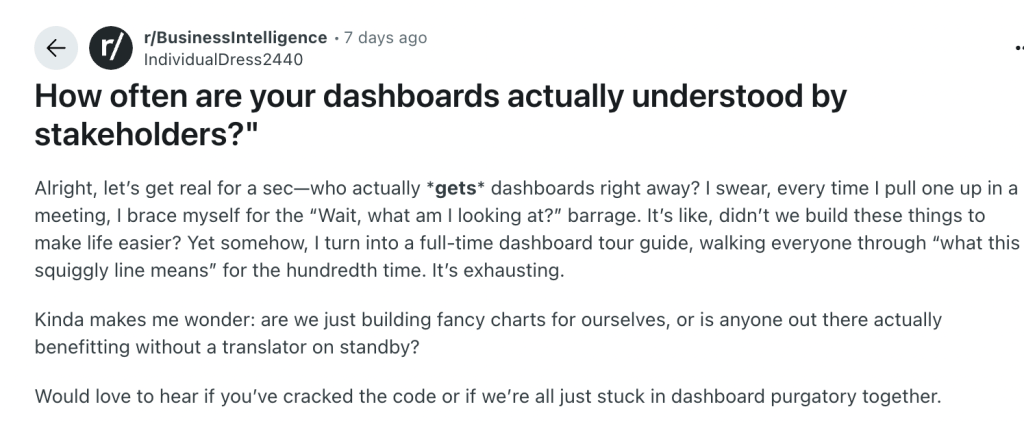
The examples below cover leadership, sales, marketing, finance, projects, operations, HR, support and product teams. Each needs different metrics, access controls and refresh intervals.
If you already know the use case and need a tool, see our dashboard builder comparison. This article focuses on what to build and how to evaluate whether it works.
When to move a spreadsheet workflow into a dashboard
Spreadsheets remain useful for analysis and flexible modeling. Consider a dashboard when repeated reporting, inconsistent definitions or shared operational actions need a managed interface. Excel can support collaboration; the issue is whether your current process provides the controls and reliability you need.
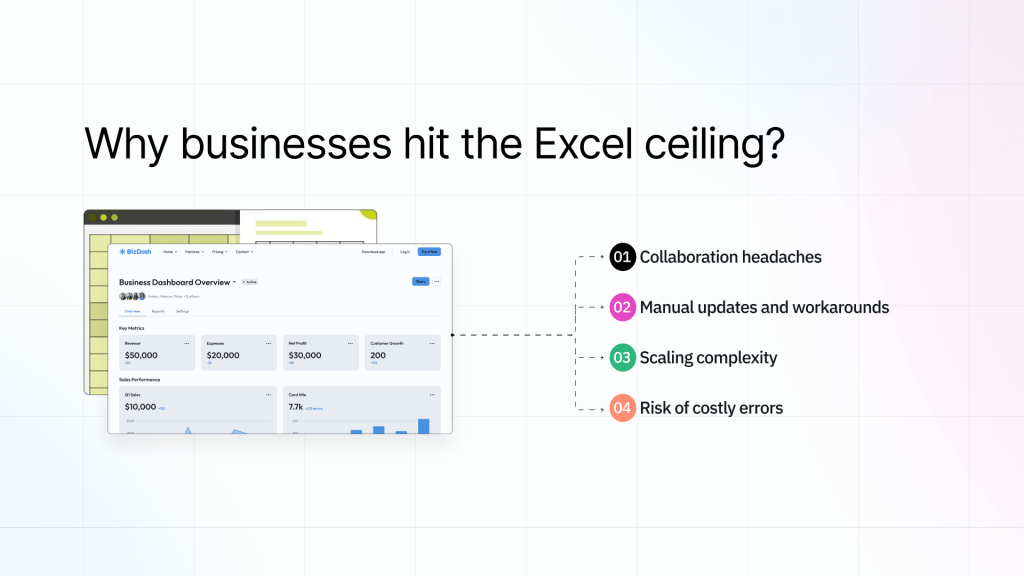
1. Collaboration headaches
Separate copies and emailed reports can make it difficult to identify the current version. A shared dashboard can provide a consistent view, provided the source, refresh time and permissions are defined. It should not expose all underlying records to every viewer.
2. Manual updates and workarounds
Repeated exports and manual joins are opportunities for automation. Connect approved sources and schedule the required transformations. Show failed refreshes explicitly rather than leaving an old value on screen with no warning.
3. Scaling complexity
Complexity depends on the dataset, formulas and workflow, not a fixed SKU count. Aggregate data close to the source, paginate detailed tables and test filters against representative volume before rolling out a dashboard.
4. Risk of costly errors
Spreadsheet errors and dashboard errors can both affect decisions. Reconcile totals against the source system, validate transformations and assign a metric owner. A database connection alone does not make the displayed data correct.
What to measure before changing the process
- Time spent assembling each report.
- Frequency of reconciliation errors or conflicting numbers.
- Delay between a source change and its visibility to the team.
- Time from an exception appearing to an accountable person taking action.
Also, read our latest blog on “Business application development: A complete guide“.
How business dashboard automation works
Automation connects a defined trigger to a repeatable process. A dashboard can display the outcome and provide controlled actions, but the underlying integration, refresh schedule and failure handling still need to be implemented.
Four parts of a dependable implementation
1. Connected data sources
Identify the source of truth for each metric and choose direct queries, scheduled synchronization or event-driven updates. Document API limits, delayed records and what happens when the source is unavailable.
2. AI-powered forecasting & reporting
Forecasting and anomaly detection require an appropriate model, data pipeline and evaluation process. An AI app builder can help create the interface, but generating a dashboard does not automatically provide a validated forecasting service.
3. Enterprise-grade governance
Configure permissions, change control and audit requirements around the actual data and actions. Test access with different roles. A chart hidden in the interface is not a substitute for server-enforced authorization.
4. Self-serve dashboards for everyone
Provide a small set of useful filters, plain-language metric definitions and a way to inspect supporting records. Self-service works best when people can answer a business question without having to understand the database schema.
What are the types of the best business dashboards?
A business dashboard serves different organizational needs depending on its purpose and audience. Understanding the key types helps businesses choose the right solution for their specific requirements.
1. Strategic business dashboards
Strategic dashboards help executives track progress against longer-term goals. Show the current value, target, comparison period and owner for a small number of agreed measures. Monthly or weekly data may be more appropriate than minute-by-minute updates.
Key characteristics include:
- Long-term trend analysis and forecasting capabilities
- Company-wide KPIs and strategic goal tracking
- High-level financial metrics and market analysis
- Risk management tools and performance benchmarks
2. Operational business dashboards
Operational dashboards help staff act on current work, such as overdue tickets, stock shortages or failed jobs. Choose a refresh interval that matches the response required and display when the underlying data was last updated.
Essential features include:
- Real-time data updates for immediate response
- Process efficiency monitoring and alerts
- Detailed operational metrics and KPIs
- Integration with daily workflow systems
3. Analytical business dashboards
Analytical dashboards help analysts explore historical patterns using filters, drill-downs and comparisons. They may sit on top of a warehouse or governed metrics layer rather than querying transaction systems directly.
Use consistent definitions across views. For example, a revenue chart should make clear whether it shows bookings, invoiced amounts, recognized revenue or collected cash.
4. Tactical business dashboards
Tactical dashboards support departmental goals and near-term planning, such as a sales target or delivery milestone. They connect a measurable target to a named owner and review cadence.
Also read, “Top free tools for building business apps“.
Top 10 Examples of business dashboards
The ten examples below are suggested designs. The retained screenshots illustrate layouts from the original article, not verified customer implementations or evidence that a vendor provides every proposed feature.
1. Executive summary dashboard
Audience: executive team. Suggested KPIs: revenue against target, gross margin, cash balance, customer retention and critical operational exceptions. Decision: which deviation needs an owner and follow-up at the weekly review?
Example:

Keep this view compact. Show the reporting period and target beside each metric, with a drill-down to its source. Avoid combining financial measures that use different currencies or recognition rules without explaining the conversion.
2. Sales performance dashboard
Audience: sales managers. Suggested KPIs: pipeline by stage, stage conversion, win rate, deal age and closed revenue. Decision: which opportunities require coaching or escalation?
Example:
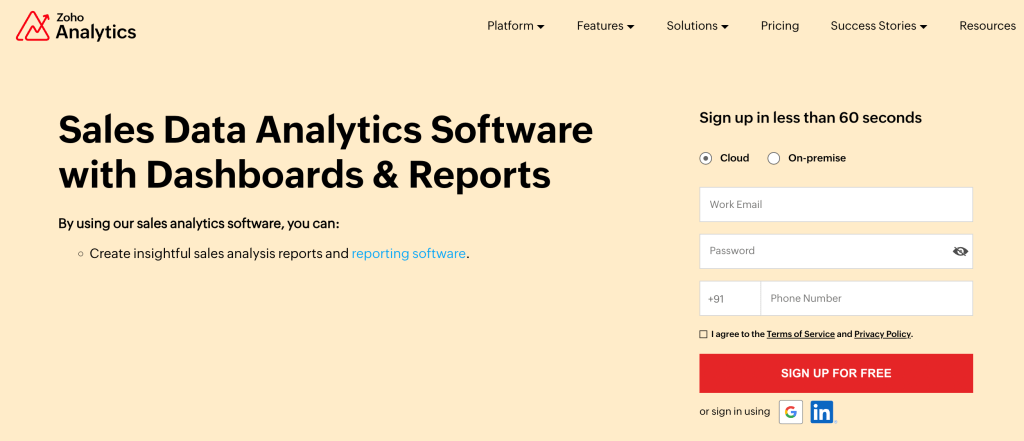
Define the denominator and time period for win rate. Separate actual closed revenue from forecast pipeline, and make expected close dates and stale opportunities visible.
3. Marketing ROI dashboard
Audience: marketing and revenue operations. Suggested KPIs: spend, qualified leads, conversion rate and attributed pipeline. Decision: which campaigns deserve investigation or a budget adjustment?
Example:
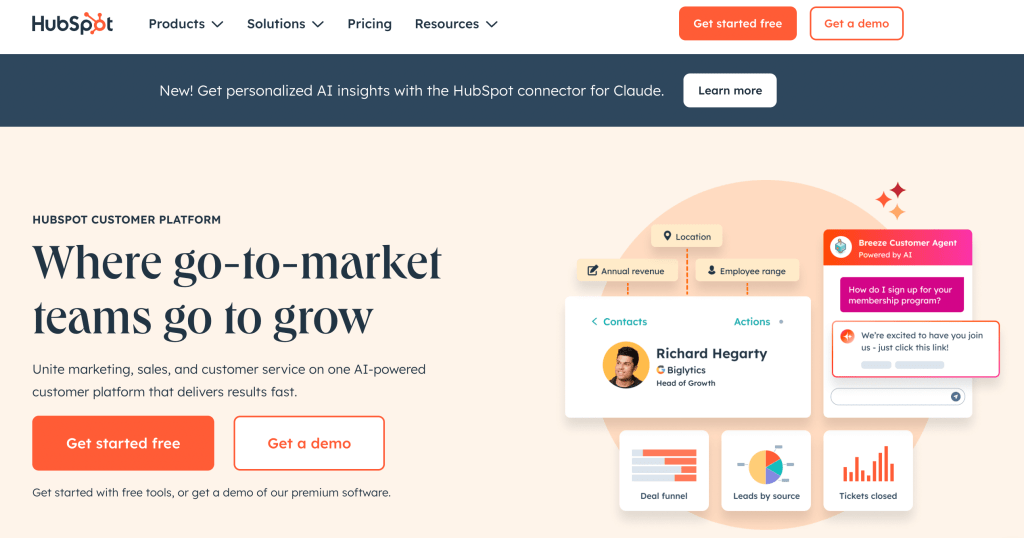
Document the attribution model and reporting window. A campaign’s recorded conversions depend on tracking and consent coverage; they are not a complete measurement of every influenced buyer.
4. Finance and budgeting dashboard
Audience: finance. Suggested KPIs: cash balance, spend versus budget, gross margin and aged receivables. Decision: which variance or overdue invoice needs action?
Example:
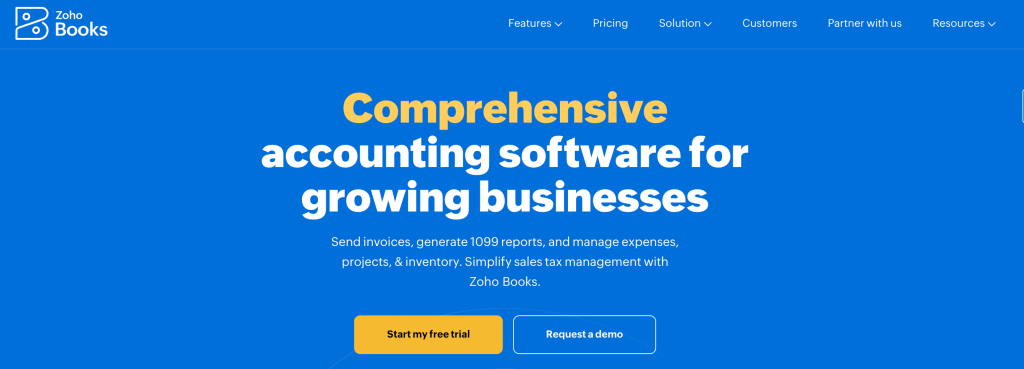
Reconcile the dashboard to the finance system before using it for reporting. Make the period, currency, accounting basis and treatment of adjustments explicit.
5. Project management dashboard
Audience: project and delivery managers. Suggested KPIs: milestone status, blocked work, overdue tasks and capacity. Decision: which dependency needs an owner or a revised plan?
Example:
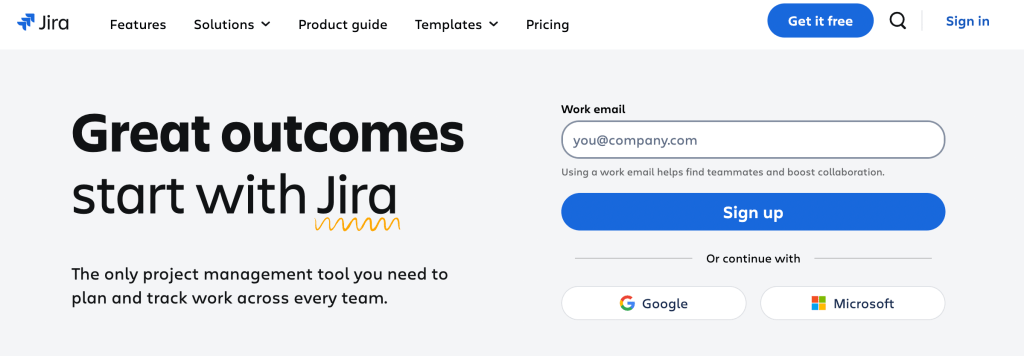
Use drill-downs to the underlying task or issue. Avoid equating a high count of completed tasks with business value when task sizes and outcomes differ.
6. Operations control center
Audience: operations managers. Suggested KPIs: order backlog, fulfillment time, stock exceptions and supplier delays. Decision: which orders or facilities require intervention today?
Example:
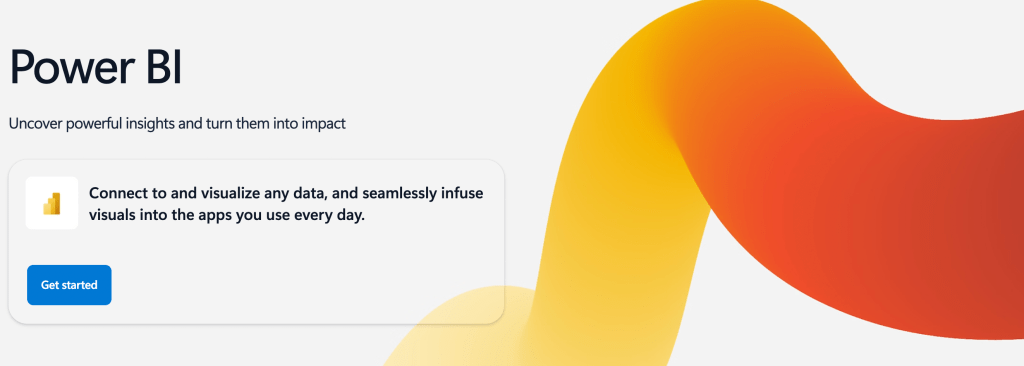
Separate an alert from an action. A manager might inspect a stock exception before submitting a replenishment request; any write operation should validate inputs and permissions at the backend.
7. HR and talent dashboard
Audience: HR and authorized managers. Suggested KPIs: headcount, hiring pipeline, time to fill and aggregate retention. Decision: where does the team need staffing or process attention?
Example:
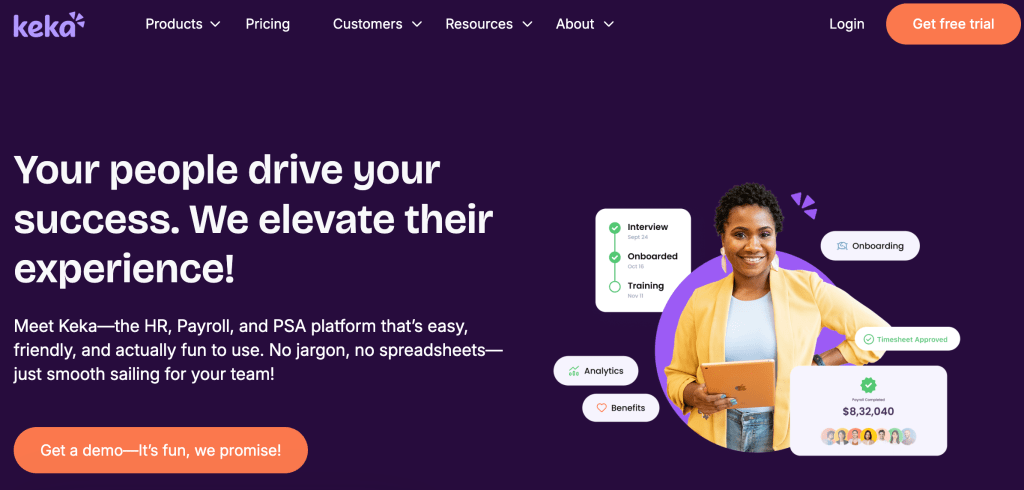
Restrict employee-level records and sensitive case details. Consider suppressing very small groups in aggregate reports so individuals cannot be identified from the results.
8. Customer support dashboard
Audience: support leads. Suggested KPIs: backlog age, first response time, resolution time, SLA breaches and CSAT. Decision: which queue or customer needs attention?
Example:
Show sample size for satisfaction scores and distinguish reopened tickets from new tickets. AI tagging may help triage, but a tag alone is not a validated churn prediction.
9. Product & feature adoption dashboard
Audience: product and engineering teams. Suggested KPIs: activation, feature adoption, cohort retention and funnel completion. Decision: where are users failing to reach the intended outcome?
Example:
Define meaningful product events and exclude internal or test activity where appropriate. An increase in event volume does not necessarily mean an increase in successful user outcomes.
10. CEO dashboard
Audience: CEO. Suggested KPIs: a small set of company goals, runway assumptions, customer health and major risks. Decision: which trade-off or cross-team escalation needs executive attention?
Example:
This is a curated version of the executive summary, not a separate requirement for every organization. Keep assumptions next to forecasts and link to the departmental detail instead of duplicating every chart.
Choose the example that supports the most urgent decision. You do not need all ten dashboards before starting. A single well-maintained view can be more useful than a large collection of unowned reports.
What are the key benefits of business dashboards?
Dashboards can reduce repeated reporting work and make exceptions easier to investigate. Measure their value against a baseline, such as time spent assembling reports or time from an issue appearing to someone acting on it.
The following benefits depend on implementation and adoption:
1. Real-time visibility into business performance
A suitable refresh schedule can shorten the wait for information. A daily finance summary and an incident queue have different freshness requirements; define the acceptable delay for each.
2. Fewer manual reports and clearer data ownership
Integrations can reduce repeated exports and copying. They do not automatically remove data silos or reconcile conflicting definitions. Assign ownership for source mappings and transformations.
3. Better alignment across departments
Shared metric definitions can make cross-team discussions more productive. Record the formula, source, reporting period and owner so teams understand what each number represents.
4. Stronger executive decision-making
Pair a summary with the information needed to investigate it: a baseline, target, trend and underlying records. Highlight exceptions without hiding uncertainty.
5. Scalability and customization for growing teams
Test performance as data volume and users grow. Use server-side filtering and aggregation, and confirm that permissions apply consistently to charts, detail tables and exports.
6. AI-powered insights and automation
AI can assist with explanations or integrate model outputs into a dashboard. Review those outputs and track errors before relying on them for operational decisions.
7. Better investor and board reporting
Use a reproducible reporting snapshot for board or investor materials. Keep the date and metric definitions visible so later changes to the live dashboard do not make past reports ambiguous.
Where AI fits in: From manual inputs to predictive intelligence
Distinguish AI used to build the dashboard from AI used inside it. Generating charts and queries is a development capability. Forecasting demand or recommending purchases is a separate production capability with its own data, model and validation needs.
How AI-powered dashboards drive smarter decisions
AI-powered forecasting
Evaluate forecasts against historical holdout periods and a simple baseline. New products or markets may have too little relevant history for reliable estimates. Display uncertainty and assumptions instead of presenting a generated forecast as a guaranteed outcome.
Real-time anomaly detection
Anomaly detection can flag values for investigation. Define alert thresholds, measure false positives and assign a response owner. Detection speed depends on refresh frequency, processing and delivery.
Automated recommendations
Show the data and assumptions behind recommendations. Require human approval before consequential changes such as purchasing, pricing or staffing, and record whether the recommendation was accepted.
Process automation at scale
Automate repeatable steps with explicit validation, retry behavior and monitoring. Keep the dashboard’s display logic separate from the jobs that clean data or generate reports.
Illustrative example: a retailer’s replenishment dashboard
Consider an illustrative retailer with sales, stock and purchase-order data in separate systems. A dashboard could combine these into a replenishment view and, if needed, display outputs from a separately validated demand model.
- Combine stock, orders and incoming deliveries using agreed product identifiers.
- Flag low-stock records with the source timestamp and reorder rule.
- Let an authorized manager review and submit a replenishment request.
Measure the pilot against its previous process: reporting time, reconciliation errors and time to resolve exceptions. This scenario is an example of a design, not a reported customer result.
How to create a daily business dashboard
Start with one recurring decision and a limited dataset. You can keep spreadsheets for appropriate modeling tasks while moving shared operational views into a managed application.
For a daily business-metrics dashboard, follow these four steps:
Step 1: Map your workflow
Identify the audience, decision and review time. Choose a small set of metrics and give each a definition, source, owner, target and comparison period.
For example, a daily sales view could show yesterday’s closed revenue, month-to-date progress and stalled opportunities. Define the business timezone and how late-arriving records affect totals.
Step 2: Identify integration points
Map each metric to its authoritative system. Document credentials, access permissions, update frequency and any joins or transformations.
Implement the required connections and show a last-successful-refresh timestamp. Decide whether stale data remains visible with a warning or whether the view should be unavailable.
Step 3: Choose the right tools
Compare a BI tool for analytical reporting with an internal app builder for forms and actions. Our low-code dashboard builder guide provides a shortlist and evaluation checklist.
Before selecting a platform, test these requirements:
- Source connectivity and acceptable query performance.
- Backend authorization for each role, including exports and write operations.
- Refresh failure handling, change control and recovery.
Step 4: Start small, scale strategically
Build one screen and validate it against known source records. Test empty datasets, stale data, failed queries, mobile layouts and unauthorized requests before expanding.
Ask intended users to complete a real task. Measure whether they find the exception, understand the metric and take the correct action. Assign ongoing ownership for queries, access reviews and metric definitions.
Building a business dashboard with ToolJet
ToolJet can generate data-connected internal apps from prompts and let your team refine them visually. It is relevant when a business dashboard also needs forms, record updates or operational actions.
What to evaluate
Built to scale: From startups to enterprises
Define the expected workload before deployment. Test representative data volume, concurrent users and query behavior; capacity depends on the application and its infrastructure.
Data connections and operational actions
Use ToolJet’s 100+ integrations to connect databases, APIs and business systems. Verify the connector and operations required for your project.
AI-powered dashboard development
Describe the required screens and data to the AI app builder, then inspect generated queries and events in the visual builder. Test calculations, permissions and writes before release.
Built-in governance and security
Review the selected plan for the governance capabilities your project requires:
- Role-based access controls (RBAC)
- SSO and Identity Provider integrations
- Version control and audit logging
- Support for multi-environment deployments
Consult ToolJet’s security information and your own compliance team. Product capabilities alone do not make a particular dashboard or data-processing workflow compliant.
Business collaboration with IT oversight
Business teams can help define metrics and refine interfaces. IT should still own integration credentials, backend authorization, release controls and the boundaries for self-service changes.
Refresh frequency and responsiveness
Configure the refresh behavior your workflow needs. End-to-end delay includes the source update, query, network and rendering time, so measure it rather than assuming zero latency.
Measure outcomes in your own pilot
Use published customer case studies to understand specific implementations. Evaluate your own project against measurable acceptance criteria:
- Time required to prepare the recurring report.
- Accuracy against the source system and clarity of metric definitions.
- User task completion and time to resolve an exception.
Ready to build smarter business dashboards?
Keep Excel where it fits and replace only the process that needs shared access, repeatable updates or controlled actions. A dashboard should solve a defined problem rather than add another reporting surface.
Write down what success means before building: less reporting effort, a shorter exception-response time or a more reliable reconciliation process.
Start with a ToolJet template or describe a dashboard to the AI app builder. Confirm integrations and deployment requirements before connecting production data.
A useful prompt is: “Build a daily sales dashboard using our orders and accounts tables. Show revenue against target, overdue orders and a filter by region. Add a last-updated timestamp and a detail table.”
Review the generated queries, define who may see each region and test the dashboard against known totals.
Ready to evaluate a business dashboard?
For private infrastructure requirements, compare Self-Hosted and managed hosting options. Review the relevant plan and add-ons before the pilot.
Try ToolJet and check current plans for the allowances that match your project.